Measuring Code Execution Time on ARM Cortex-M MCUs
This article is written by Jean J. Labrosse, RTOS Expert.
There are many ways to measure code execution time. As an embedded engineer, I often used one or more digital outputs and an oscilloscope. You simply set one of the outputs high before you execute the code you want to monitor and bring the output low afterwards. Of course, there is a fair amount of setup work before you can do this: find one or more free outputs, make sure they are easily accessible to probe, configure the port as outputs, write code, compile, setup the scope and so on. Once you have a signal, you might need to monitor it for a while to see minimums and maximums. Digital storage scopes make this process easier, but there are other methods even easier than that.
Another way to measure execution time is to use a trace-capable debug probe. You simply run the code, look at the trace, compute the delta time (typically manually) and convert CPU cycles to microseconds. Unfortunately, the trace gives you one instance of execution, and you might have to look further down the trace capture to find the worst-case execution time. This could be a tedious process.
The Cortex-M cycle counter
The CoreSight debug port found on most Cortex-M based processors contains a 32-bit free running counter that counts CPU clock cycles. The counter is part of the Debug Watch and Trace (DWT) module and can easily be used to measure the execution time of code. The following code is all that is needed to enable and initialize this highly useful feature.
#define  ARM_CM_DEMCR      (*(uint32_t *)0xE000EDFC)
#define  ARM_CM_DWT_CTRL   (*(uint32_t *)0xE0001000)
#define  ARM_CM_DWT_CYCCNT (*(uint32_t *)0xE0001004)


if (ARM_CM_DWT_CTRL != 0) {        // See if DWT is available
    ARM_CM_DEMCR      |= 1 << 24;  // Set bit 24
    ARM_CM_DWT_CYCCNT  = 0;
    ARM_CM_DWT_CTRL   |= 1 << 0;   // Set bit 0
}
Using the DWT cycle counter to measure code execution time
You can measure and compute the execution time of a code segment by reading the value of the cycle counter before and after that segment, as shown below. Of course, this means that you have to instrument your code, but you get a very accurate value.
uint32_t  start;
uint32_t  stop;
uint32_t  delta;

start = ARM_CM_DWT_CYCCNT;
// Code to measure
stop  = ARM_CM_DWT_CYCCNT;
delta = stop – start;
Because we are using unsigned math, delta represents the actual execution time (in CPU clock cycles) of the measured code, i.e. even if stop is smaller than start.
Of course, it’s possible that interrupts occur while measuring the execution time of the code bracketed between the start and stop readings, so you will most likely have different values each time you execute this sequence. In this case, you might want to disable interrupts during the measurement to remove that artifact as shown below but, with the understanding that disabling interrupts could significantly reduce interrupt latency during the measurement. That being said, it might be useful to include the artifacts of interrupts as they affect your code’s deadlines.
Disable Interrupts;
start = ARM_CM_DWT_CYCCNT;
// Code to measure
stop  = ARM_CM_DWT_CYCCNT;
Enable Interrupts;
delta = stop – start;
If the code being measured contains conditional statements, loops or anything that can cause variations, then the value obtained might not represent the worst-case execution time. To correct this, you can simply add a peak detector as shown below. Of course, max needs to be declared and initialized to the smallest value (i.e. 0) before making any measurements.
start = ARM_CM_DWT_CYCCNT;
// Code to measure
stop  = ARM_CM_DWT_CYCCNT;
delta = stop – start;
if (max < delta) {
    max = delta;
}
Similarly, it might be interesting and useful to also know the minimum execution time. min simply needs to be declared and initialized to the largest possible value (i.e. 0xFFFFFFFF) prior to making any measurements. Here is the new code:
start = ARM_CM_DWT_CYCCNT;
// Code to measure
stop  = ARM_CM_DWT_CYCCNT;
delta = stop – start;
if (max < delta) {
    max = delta;
}
if (min > delta) {
    min = delta;
}
You could also measure the time it takes for a task (assuming you are using an RTOS) to service an event it’s waiting for. For example, you might want to know whether your task is meeting its deadlines. You can either add the ‘stop’ code immediately after the ‘Wait for …’ code or after your task has actually performed the necessary action in response to the interrupt; both values could be interesting and meaningful.
void  MyISR (void)
{
    Clear interrupt source;
    start = ARM_CM_DWT_CYCCNT;
    Notify task that interrupt occurred;
}


void  MyTask (void)
{
    Task initialization;
    while (1) {
        Wait for notification from ISR;
        stop  = ARM_CM_DWT_CYCCNT;
        delta = stop – start;
        if (max < delta) {
            max = delta;
        }
        if (min > delta) {
            min = delta;
        }
        Code to handle event;
    }
}

// Code to measure
stop  = ARM_CM_DWT_CYCCNT;
delta = stop – start;
if (max < delta) {
    max = delta;
}
if (min > delta) {
    min = delta;
}
Execution time also depends on whether or not the CPU is equipped with a cache, as is the case for some Cortex-M4 processors as well as Cortex-M7. If your system uses an instruction or data cache, multiple measurements for the same section of code may be inconsistent. You might consider disabling the cache to measure worst case conditions.
In order to display the values, most debuggers allow you to display those variable values live. If that’s the case, displayed variables will need to be declared with global scope to retain their values and allow live monitoring. Also, the values, unfortunately, represent CPU clock cycles, and most debuggers are not sophisticated enough to scale variables for display purposes. Assuming a 16 MHz CPU clock speed, it would be far more convenient to display 70.19 microseconds rather than 1123 cycles. If you are lucky and your CPU is running at 100 MHz, the conversion can easily be done mentally.
Elapsed Time module
You can certainly add the snippets of code to your application or use a simple module that is included in this paper. The ‘elapsed_time.c’ module consists of just 4 functions.
To use:
- Simply #include <elapsed_time.h>
- Call elapsed_time_init() prior to using the other functions defined in c.
- Define the maximum number of elapsed time measurement structures by setting ELAPSED_TIME_MAX_SECTIONS. This corresponds to the number of different code snippets you want to wrap with the stop/start code.
- Call elapsed_time_start() and pass it the index of the code snippet you want to monitor (i.e. 0 .. ELAPSED_TIME_MAX_SECTIONS-1).
- Call elapsed_time_stop() and pass it the same index that you used in the elapsed_time_start()
- If your debugger allows you to monitor variables live (i.e. while the target is running), you can display the elapsed_time_tbl[] and look at the ELAPSED_TIME structure of the corresponding index you used.
- Perform steps 4 to 6 repeatedly and subject your code to its worst and best case conditions so that the .min and .max fields of the ELAPSED_TIME structure provide a good representation of the execution time of the snippet of code you are measuring.
You will notice (see elapsed_time.c) that I didn’t disable interrupts during the measurement because ISRs might be involved and you might want to know how that impacts the perceived execution time.
void  main (void)
{
    // Some code
    elapsed_time_init();         // Initialize the module
    // Some code
}


void  MyCode (void)
{
    // Some code here
    elapsed_time_start(0);    // Start measurement of code snippet #0
    // Code being measured
    elapsed_time_stop(0);     // Stop and
    // Some other code
}
Of course, the minimum and maximum execution times depends on how often you make the measurements as well as whether or not the code is subject to its best and worse conditions, respectively.
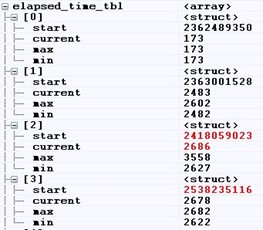
The screenshot of the LiveWatch window in IAR Embedded Workbench below shows the values in raw form. elapsed_time_tbl[] is an array that stores the measurements for the different code snippets. As a side note, the start field has limited display value other than showing activity (i.e. seeing it change shows that measurements are being performed). Also, the values are displayed in CPU clock cycles and unfortunately, C-SPY doesn’t provide a scaling function to convert these values in microseconds.
You can certainly make improvements to the elapsed_time.* module. Here are some features I thought you can add. To make things slightly easier for you, I added the prototypes, variable, and structure members but, I’ll let you implement the necessary code should you find those useful.
- Add a callback function that is called when the maximum execution time exceeds a threshold (.threshold). This could be useful if you wanted to be notified (turn on an LED, sound an alarm, etc.) as soon as such a condition occurs. If fact, you could even set a breakpoint in case you wanted to see what conditions caused the threshold to be exceeded. You can add a .callback_ptr member to the ELAPSED_TIME
- Add a Boolean to Enable/Disable measurement on a per-channel basis. This way, you can instrument your code and decide which measurements you want to enable or disable. You can a structure member such as .enable to the ELAPSED_TIME structure. During debugging, you can then set .enable to 1 (to enable) or 0 (to disable) using C-SPY or, call APIs to do the same.
- A global variable to the module to specify the CPU clock frequency (elapsed_CPU_clock_frequency) which can be used to convert from cycles to microseconds. You would simply need to divide the different fields (.current, .min and .max) by elapsed_CPU_clock_frequency in the elapsed_time_stop() Make sure you initialize this variable to a NON-ZERO value to avoid a divide-by-zero.
About the author
This article is part of a series on the topic of developing applications with RTOS.
Jean Labrosse, Micrium Founder and author of the widely popular uC/OS-II and uC/OS-III kernels, remains actively involved in the evolution of the uC/ line of embedded software.
Given his wealth of experience and deep understanding of the embedded systems market, Jean serves as a principal advisor and consultant to Weston Embedded Solutions helping to chart the future direction of the current RTOS offerings. Weston Embedded Solutions specializes in the support and development of the highly reliable Cesium RTOS family of products that are derived from the Micrium codebase.
You can contact him at Jean.Labrosse@Weston-Embedded.com.