Debugging
Learn more about embedded development and get the most out of our products in our articles, videos och recent webinars.

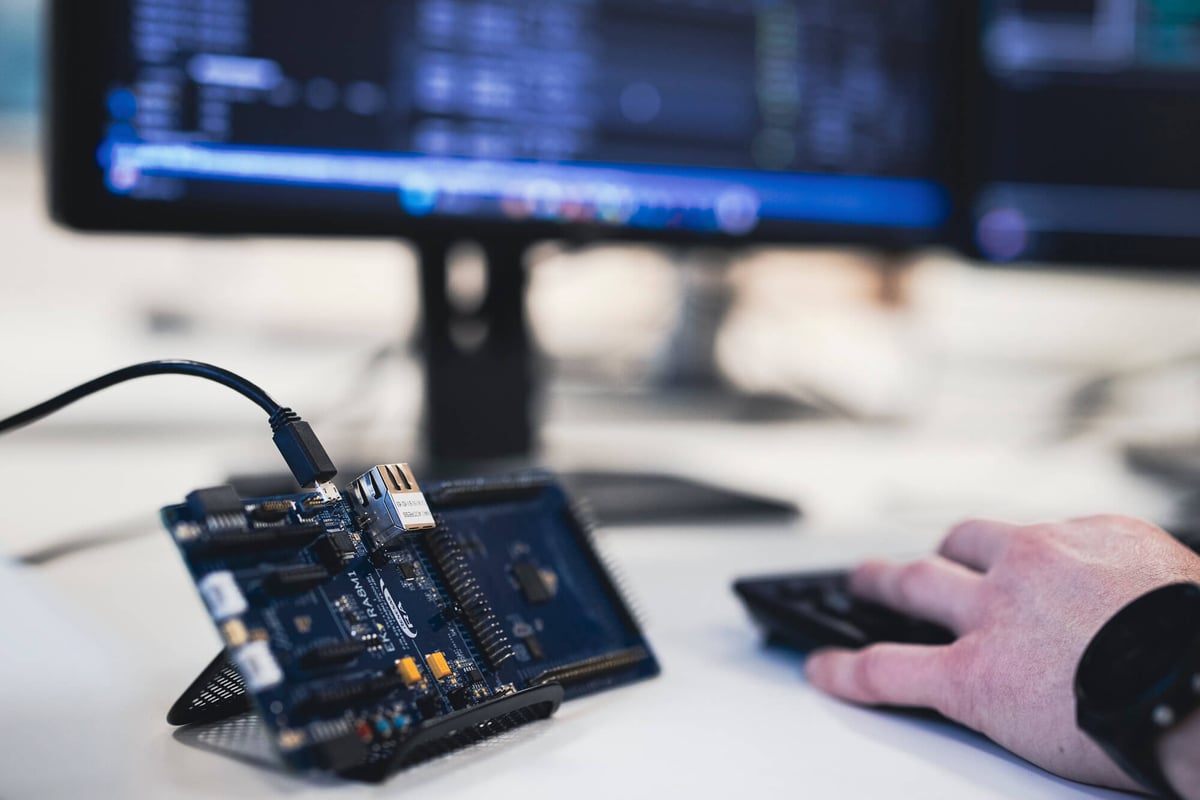
Back to the roots – tracing and debugging as a way to increase efficiency

The benefits of multicore debugging