
Programming
Learn more about embedded development and get the most out of our products in our articles, videos och recent webinars.

Real Time Operating Systems with KA and nKA Interrupts

Don’t delete RTOS objects at Run-Time!

Writing optimizer-friendly code

RTOS CPU Overhead
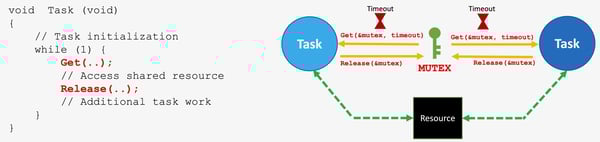
Resource Sharing in RTOS-based Designs

Semaphores or Mutexes for sharing resources in RTOS-based designs
6 misconceptions about the RTOS tick

Stack Overflows in RTOS-Based Designs - Part 1

