
Precise timing, predictable performance powered by GLIWA T1 and IAR
GLIWA T1 is the most frequently deployed timing tool in the automotive industry, being used for many years in hundreds of mass-production projects.
As a worldwide premiere, the ISO 26262 ASIL‑D certified T1-TARGET-SW allows safe instrumentation-based timing analysis and timing supervision. In the car. In mass production.
A perfect match: GLIWA T1 and IAR
Among other compiler tool suites, GLIWA T1 supports the IAR embedded development tools for Arm Cortex-M processors, including the pre-certified edition. This turns out to be a very happy combination, as the optimizations offered by the IAR toolchain align perfectly with the requirements of T1.
The timing measurement solution T1 allows you to get an intuitive insight into the real-time characteristics of your software. It is a portable, software-only solution that involves instrumentation of the software to be measured: when the real-time operating system (RTOS) makes a task switch, a call is made to T1_TraceEvent(), which logs the event with a timestamp. The accumulated trace of many events can then be uploaded to a PC, where the trace is visualized. Suddenly, you can see unexpected behavior, including tasks that take too long, or too little time, or miss some instances completely, just to pick some examples.
Inside T1: Real-time intuitive insights
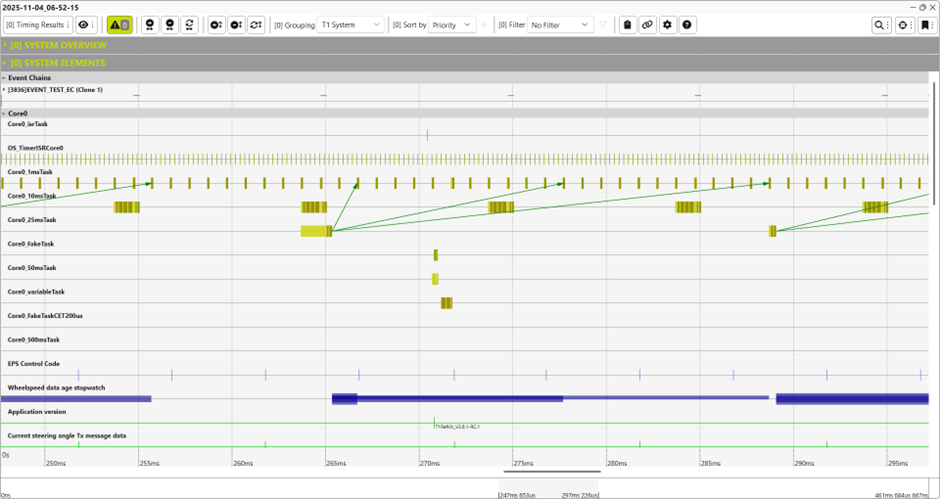
The following screenshot illustrates the T1.scope visualization of T1. It enables the user to clearly understand the temporal behaviour within their system. In addition to other features, T1 provides profiling of all relevant timing metrics (CET, GET, DT, ...) to efficiently support system analysis.
Software-based tracing is not unique to T1. T1 might be regarded as a flavor of printf debugging, one of the oldest and most primitive ways of tracing and debugging. What makes T1 unique is its effectiveness in the domain of resource-constrained embedded systems. A fundamental issue with software-based tracing is that the instrumentation changes the system that we are trying to measure. If the overheads are too high, then the system will not run well enough to get any useful timing data. In this sense, it is desirable to get the least out of T1. Even with very low overheads, if the overhead is very stable, we can attempt to identify the impact of the overhead, whereas with a very variable overhead, we can only guess at how much time was really used by the application and how time was used by the T1 instrumentation.
How IAR enables stable, predictable timing
Let us look at the pre-processed (hence lots of “magic” numbers) C source for a small example, which shows the happy marriage between T1 and the IAR toolchain, including the IAR C/C++ compiler. This routine does some pre-processing of a traced event, splitting apart the combined ‘eventInfo’ value into the component event and info fields and selecting the appropriate event handler for the given event. The big ‘if’ condition is testing to see if the event is one of a given set of values. A naïve approach would be a sequence of if-else conditions, or a switch statement. We use a bit mask to try to help the compiler find a more efficient solution, which works very well with IAR as we will see.
T1_tickUint_t T1_TraceEventNoSusp__( T1_scopeFgConsts_t *pScopeConsts, T1_eventInfo_t eventInfo ){ T1_uint8Least_t handlerIdx; T1_uint16Least_t eventId = ( eventInfo >> 10 ) & 0x3Fu; eventId = ( 15u < eventId ) ? 15u : eventId; handlerIdx = 0u; if( 0uL != ( ( ( ( 1uL << 12u ) | ( 1uL << 1u ) | ( 1uL << 3u ) | ( 1uL << 2u ) | ( 1uL << 14u ) | ( 1uL << 13u ) | ( 1uL << 4u ) | ( 1uL << 5u ) | ( 1uL << 6u ) | ( 1uL << 8u ) | ( 1uL << 7u ) ) >> eventId ) & 1uL ) ) { handlerIdx = eventId; eventInfo &= 0xFFFFFFFFuL >> ( 32 - 10 ); } return pScopeConsts->pDispatcher( pScopeConsts, eventInfo, handlerIdx << 1 );}
Now let us turn to the disassembled output of the compiler.
T1_TraceEventNoSusp__: 0x3f20: 0x0a8b LSRS R3, R1, #10 0x3f22: 0x2b0f CMP R3, #15 ; 0xf 0x3f24: 0xbf28 IT CS 0x3f26: 0x230f MOVCS R3, #15 ; 0xf 0x3f28: 0xf247 0x12fe MOVW R2, #29182 ; 0x71fe 0x3f2c: 0x40da LSRS R2, R2, R3 0x3f2e: 0xf012 0x0201 ANDS.W R2, R2, #1 0x3f32: 0xbf1c ITT NE 0x3f34: 0x005a LSLNE R2, R3, #1 0x3f36: 0xf3c1 0x0109 UBFXNE R1, R1, #0, #10 0x3f3a: 0x6a43 LDR R3, [R0, #0x24] 0x3f3c: 0x4718 BX R3 0x3f3e: 0xbf00 NOP
The first thing to note is that there is no stack frame. The function call through pDispatcher has been tail-call-optimized to a BX instruction. This, combined with the compiler’s use only of function-volatile registers, means that no stack frame is required. For such a small function, the overhead of allocating and tearing down a stack frame would have been significant.
The next thing to note is that there are no conditional branches. The two conditions (one ‘?:’ and one ‘if’) have been compiled using Thumb2 conditional instructions in an IT block. This branchless code runs particularly well on a modern, pipelined Arm processor with burst fetches. Not only does it remove the possibility of branch misprediction, but it also leaves the limited branch prediction resources untouched, so that the calling code context might perform better. And most important of all, the timing will be much more stable than with conditional branches. Our bit mask trick for set membership has certainly paid off.
Why write assembly when the compiler gets it right?
Another noteworthy optimization is the use of mostly 16-bit Thumb instructions, to make the code small. Although smaller instructions are not inherently faster, smaller code makes the instruction cache go further. Also to reduce the number of cache lines, the IAR toolchain support for code alignment is exploited by T1, which explains the NOP at the end of the code. This is padding to ensure that the subsequent function is 8-byte aligned. Even without knowing the processor cache, 8-byte code alignment strikes a good balance between code size / padding and performance.
As we wrap up, perhaps you are wondering why we do not simply write it in assembly, if we care so much about the performance of this code. There are a few factors, principally the overall cost/benefit consideration. When the IAR C/C++ compiler produces such high-quality object code from portable C, there can be no justification for the cost of writing and maintaining non-portable assembly code.
What’s next?
See how GLIWA T1 and IAR can enhance your next automotive project. Explore GLIWA’s timing tool, how IAR supports automotive embedded development, and try the interactive demo of IAR’s Functional Safety solutions.
The title of this blog post is a tribute to Jakob Engblom’s iconic paper, Getting the Least Out of Your C Compiler.
