Programming
Learn more about embedded development and get the most out of our products in our articles, videos och recent webinars.

Code and data size for an RTOS-based design

Real Time Operating Systems with KA and nKA Interrupts

Don’t delete RTOS objects at Run-Time!

Writing optimizer-friendly code

RTOS CPU Overhead
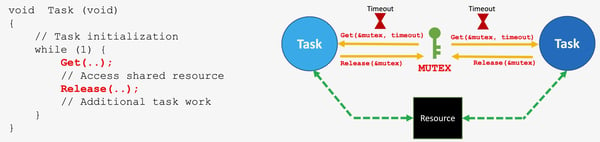
Resource Sharing in RTOS-based Designs

Semaphores or Mutexes for sharing resources in RTOS-based designs
6 misconceptions about the RTOS tick