Debugging with microcontroller registers
Debugging of embedded systems software typically focuses on code execution, memory values, stack pointers, interrupt timings and register values. In this article, we will show you how to debug register values using IAR Embedded Workbench for ARM. The toolset provides several features for reviewing register values, and some of these are added in recent releases. Make sure you are aware of the possibilities available to you!
Register Window
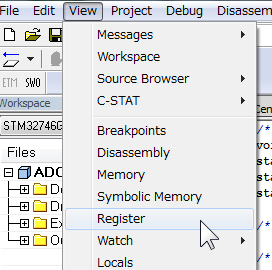
This is the basic feature for working with registers. Go to View > Register.
Here, you can see the categorized register values and, if the register is writable, you can also write values in the register.
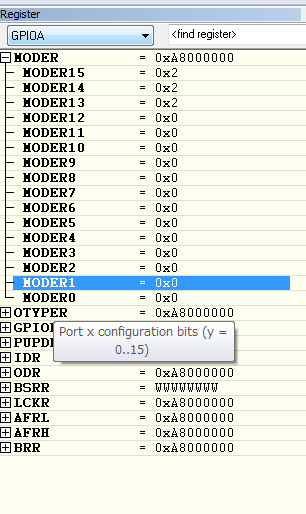
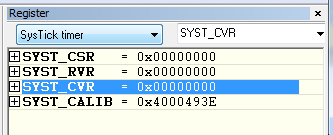
Version 7.50 and later versions of IAR Embedded Workbench for ARM includes a search function for the register window, enabling you to search for a register in the source code.
Check register - address mapping
Sometimes you might want to find a register by its address. Usually, microcontroller vendors provide the peripheral driver source code. However, the code is highly structured and it is sometimes difficult to find the exact address of the register. IAR Embedded Workbench for ARM provides an easy way to view register names and address mapping.
Go to Project > SFR setup
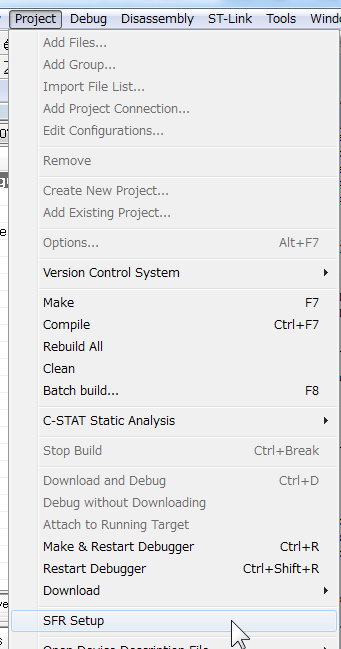
This will show the SFR Setup window.
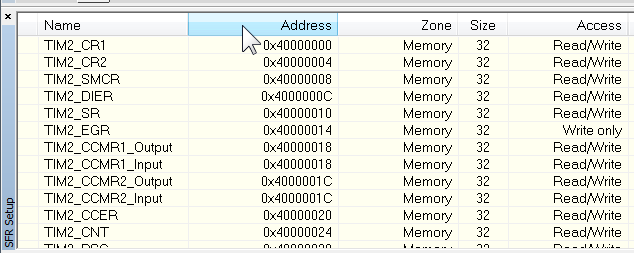 This window displays the currently defined SFRs (Special Function Registers) that C-SPY has information about. You can choose to display only factory-defined or custom-defined SFRs, or both. If you click the header column “Address”, the data will be sorted by memory address and you can easily see what register corresponds to an address. To see the details of a register, search for it in the Register window.
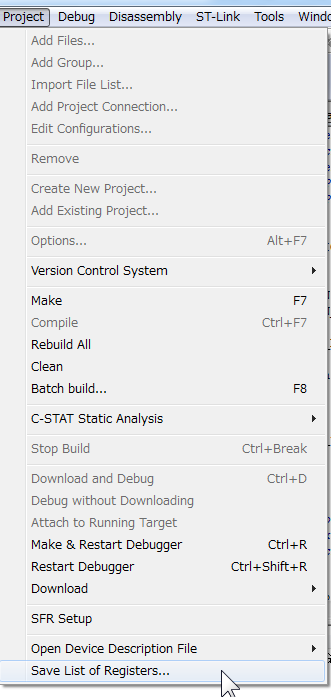
Dump all the register values
If your application in sometimes working and sometimes not, try comparing register values to find the problem. A way to do that is to dump all register values during the debug session.
Go to Project > Save List of Registers.
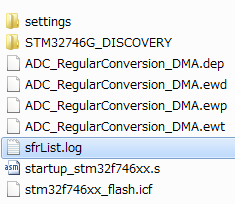
As a default, the file sfrList.txt will be generated in the project directory.
The file consists of a TAB separated register list with information about the size, location, and access type of each register. If you are in a debug session, the list also includes the current value of the register.
For easier analysis, the text can be copied and pasted into a spreadsheet program.
Summary
Register values is one of most important parts of embedded systems, and IAR Embedded Workbench for ARM provides several features that can make your debugging more efficient. This article provides a summary of usable features for debugging with registers, to learn all the details refer to the user guides available in the IDE and online.