How to dump variables and register values with C-SPY macros
IAR Embedded Workbench is an integrated development environment (IDE) which supports a wide range of microcontrollers. C-SPY, its built-in debugger, comes with an extensive macro system that can be used towards more efficient testing strategies.
C-SPY macro language components
There are four components in the C-SPY macro language:
-
Macro functions: a block of macro code containing statements and variables that together can perform a task when the macro function is called. Macro functions can return a value on its completion and they can receive an unlimited number of macro parameters upon their invocation.
-
Macro variables: variables defined and allocated outside the embedded application. Such variables can be used when performing C-SPY expression evaluations or even to assign values from the application's variables to them. A global macro variable can be defined outside a macro body. By doing so, it will exist throughout the whole debugging session.
-
Macro strings: a special kind of macro variable able to hold literal strings. It differs from a typical C string as it has no pointer access to a target memory. Besides, it is not NULL-terminated. The C-SPY built-in macro function
__toString()can be used for converting a NULL-terminated C string in the application (char *orchar[]) to a macro string. -
Macro statements: are expected to behave in a similar way the corresponding C statements would do. The following C-SPY macro statements are accepted:
- Expressions
- Conditional statements
- Loop statements
- Return statements
- Blocks
For more details about the macro language components, please refer to the C-SPY Debugging Guide, which you can reach from the Help menu in IAR Embedded Workbench.
Examples
For the examples below, we will take advantage of the BasicDebugging which is bundled with the product as a reference project. This project is accessible from the Help menu → Information Center → Product explorer → Getting started using IAR Embedded Workbench → Open tutorial workspace.
Example 1: Logging C variables
Any C variables existing in the target's memory can be dumped using C-SPY macros. Although, depending on the compiler's optimization level, it might use registers when storing variables that have local scope or shorter lifespans. The volatile qualifier can be used when declaring the application's variables to be used with C-SPY macros.
Near line 20, search for the declaration of the global variable callCount and add the volatile qualifier:
static volatile int_fast8_t callCount;Next, near line 35, search for the declaration of the local variable fib and also add the volatile qualifier:
volatile uint32_t fib;Now, in the function DoForegroundProcess(), right-click the PutFib(fib) function call and choose Toggle Breakpoint (Log). A red circle with an L should appear on the same line in the left side of the code editor.
Right-click once more over the same line and choose Edit Breakpoint....
Enable the C-Spy macro "__message" style checkbox.
Add the following Message:
"callCount: ", callCount:%d, " --- fib: ", fib:%d, "(0x", fib:%x, ")"And change the Conditions to Condition changed with the following Expression: callCount.
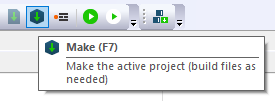
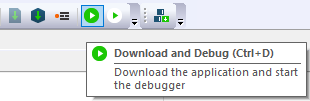
Build the project with Make (F7) and then Download and Debug (CTRL+D).
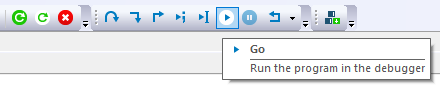
On the Debug Toolbar, click Go (F5).
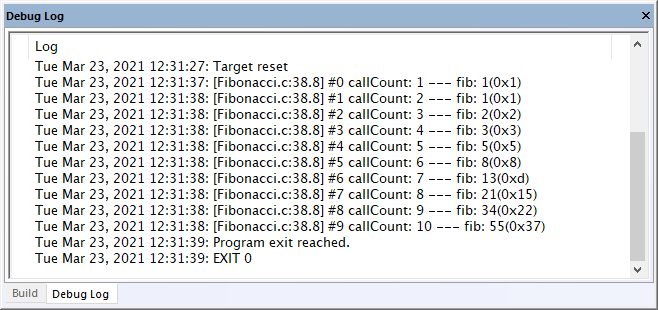
Watch the Debug Log window being updated:
Example 2: Dump C variables to a file
Go to File → New File (CTRL+N) and paste the macro functions below in this new file.
__var myFileHandle;
// Called once when the debug session starts.
execUserSetup() {
myFileHandle = __openFile("$PROJ_DIR$\\dump.txt", "a");
if (myFileHandle) {
__fmessage myFileHandle, "Logging started...\n";
}
}
dumpValues() {
__var t1, t2;
t1 = callCount;
t2 = fib;
if (myFileHandle) {
__fmessage myFileHandle, "callCount: ", t1:%d, " --- fib: ", t2:%x, "\n";
} else {
__message "ERROR: file dump.txt could not be open.";
return -1;
}
return 0;
}
// Called once when the debug session ends.
execUserExit() {
if (myFileHandle) {
__closeFile(myFileHandle);
}
return 0;
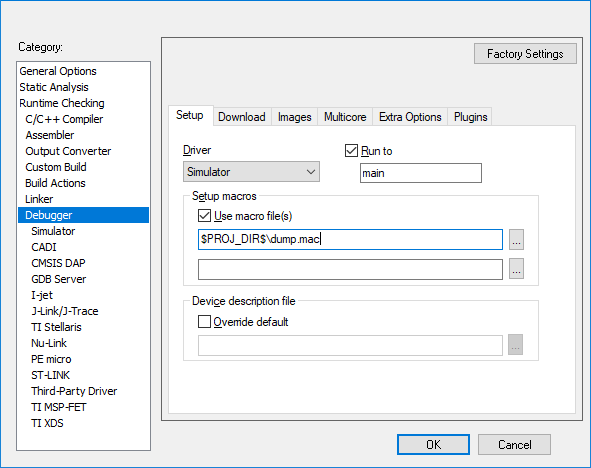
}Go to File → Save as... and save it as dump.mac inside the project's folder.
Then go to Project → Options… → Debugger → Setup and browse for the dump.mac macro file.
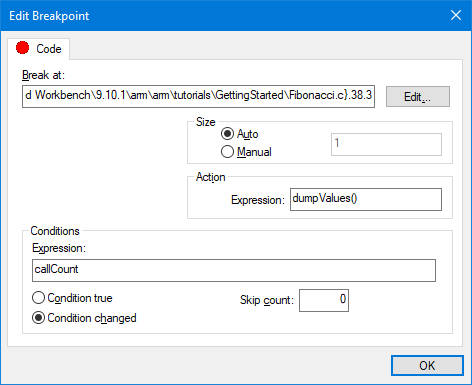
Now, in the function DoForegroundProcess(), right-click the PutFib(fib) function call and choose Toggle Breakpoint (Code). A red circle should appear on the same line in the left side of the code editor.
Select View → Breakpoints to open the Breakpoint window. Right-click this new code breakpoint and select Edit….
Enter dumpValues() in the Action field. Then, when the code stops at the breakpoint, dumpValues() will be executed.
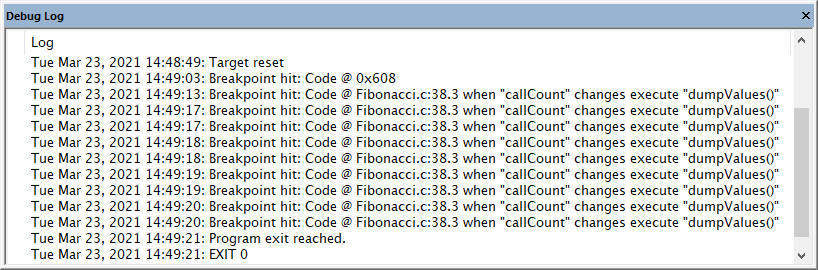
When the execution reaches this breakpoint, the Debug Log window will display a message saying the variables were dumped:
Now open the dump.txt file and verify its contents.
Example 3: Dump processor registers
The C-SPY macro function dumpRegs() defined below can be added to a macro file. Then the macro is invoked, it will emit messages containing the CPU registers in the Debug Log window. The CPU registers can be referred with a # in front of their respective names.
dumpRegs() {
  __message "R0,   R1, R2,   R3 =", #R0:%x,  ",", #R1:%x,  ",", #R2:%x,  ",", #R3:%x;
  __message "R4,   R5, R6,   R7 =", #R4:%x,  ",", #R5:%x,  ",", #R6:%x,  ",", #R7:%x;
  __message "R8,   R9, R10, R11 =", #R8:%x,  ",", #R9:%x,  ",", #R10:%x, ",", #R11:%x;
  __message "R12, R13, R14, R15 =", #R12:%x, ",", #R13:%x, ",", #R14:%x, ",", #R15:%x;
  __message "CPSR =", #CPSR:%x;
}
Manually executing C-SPY macros
It is possible to execute C-SPY macros from a macro file from within a debug session.
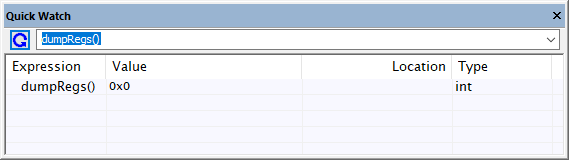
Select View → Quick Watch to show the Quick Watch window.
By entering dumpReg(), or by clicking the button, you execute the dumpReg() function. The messages are shown in the Debug Log window.
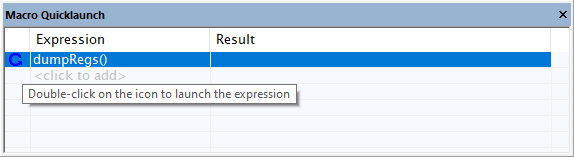
You can also use the Macro Quicklaunch window from View → Macro Quicklaunch to execute the macro:
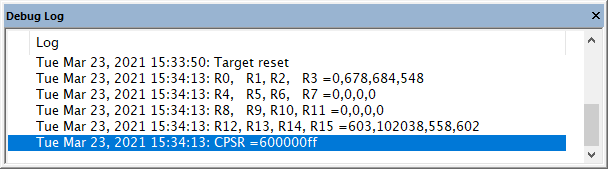
And then get the messages containing the register values in the Debug Log window:
Conclusion
In this article, we have shown a few examples specifically on how to dump C variables and register contents using C-SPY macros. The C-SPY macros can help to automate a variety of debugging and verification tasks. In combination with complex breakpoints, they can be used for hardware configuration, simulation of peripherals and feeding in the application with external data during runtime, just to mention some of the many possibilities.