The benefits of multicore debugging
The IAR Embedded Workbench for Arm has the ability to debug multicore devices in a synchronized way. In this article you will learn more about multicore debugging in general and especially how IAR Embedded Workbench for Arm handles it.
Why multicore debugging?
Today, the demand for complex applications are increasing and it’s a clear trend that multicore devices are becoming more and more popular thanks to this. And as we all know “If we develop it, debugging will come”. By using multicore devices it’s possible to load balance, take advantage in different strength of different architectures, and it will possibly lower the product cost to have one multicore device rather than multiple devices.
Being able to debug a single core in a multicore environment has been possible for a long time, but what we now have introduced is the possibility to synchronize debugging of the multiple cores. With the possibility to simultaneously debug two or more cores, you are able to find errors and bugs easier. In some cases there sure is also an advantage to handle at least basal tasks such as starting, stopping and monitoring on the core you are not focusing on right now, as the other core might have an effect on the core you are working on.
The main challenge with multicore debugging is to access two cores with one single interface. In IAR Embedded Workbench, you are able to simultaneously debug two or more identical cores, symmetric multicore processing (SMP), or two cores with different architectures, asymmetric multicore processing (AMP), with one master instance of the toolchain and one partner instance. Both cores can be started and stopped individually or simultaneously from each instance. Everything performed in one single development environment.
Two different use cases
We can see two different use cases, one where you are debugging on multiple cores of the same type, as in symmetric multicore processing SMP, and one case where the cores are of different types, as in asymmetric multicore processing AMP.
Symmetric multicore debugging is done from one instance of the debugger IDE, while in the asymmetric case one instance of the IDE is required for each core, with one acting master and the other one, acting as a partner to this.
Asymmetric multicore debugging
In asymmetric multicore processing, you can for example use a dual ARM Cortex-A9 device or a device with one Cortex-M core and one Cortex-A core. In the example below, the project for the Cortex-A core is set up as a master and the project will also download the code for the partner core into the common memory. The only setting change for the partner project it that is should not download code, only connect to the device.
When starting the master debug session it will spawn the partner session, and we get something looking like this:
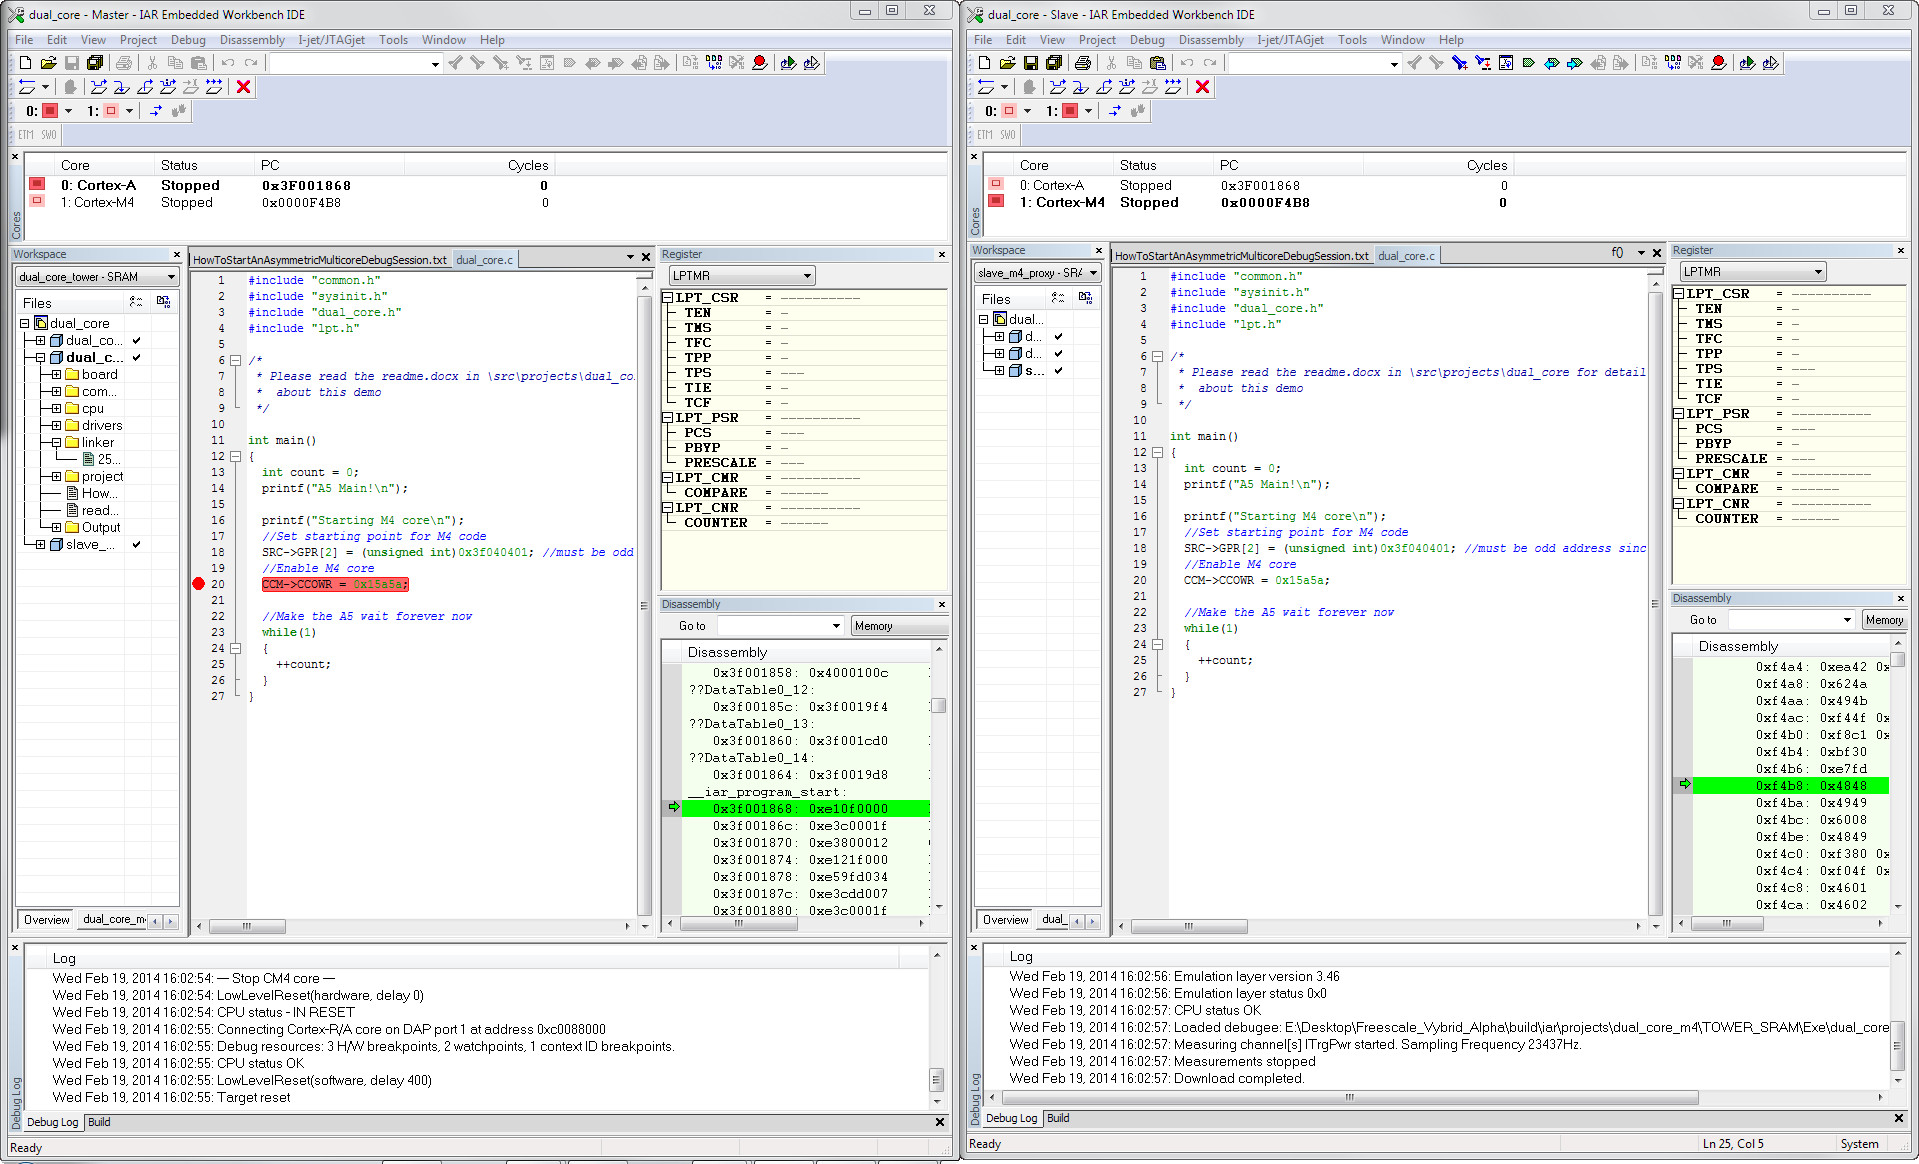
Some things that differ from a traditional single core session are:
- Each window is marked Master or Partner
- A new Cores window
- Some new items in the debug toolbar
If we take a closer look at some of the new interesting items in the IDE, the first one is the Cores window.
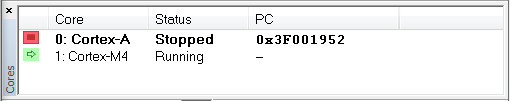
In this window, we can see that it is taken from the IDE instance connected to the Cortex-A core (bold), that it is stopped, and the PC for that core. We also get some info for the Cortex-M core, namely that it is running.
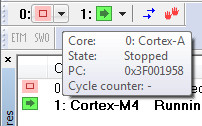
Another new item is these additions to the debug toolbar:
![]()
First there are two icons describing the state of the cores, and then the new controls starting and stopping all cores buttons.
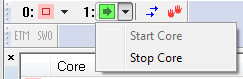
By hovering over one of the core in the toolbar, you can get further info, matching the info in the Cores window. In this toolbar, there is also a pull down menu for each core and with the use of these you can either stop or start the selected core.
 |
 |
Symmetric multicore debugging
Debugging a symmetric device with several cores is similar to the example above. But instead of two instances, only one instance of the IDE is displaying the info. Here the normal debug windows such as watch windows, memory windows etc. will display the information that is related to the core being in focus. Selecting what core to focus on is done in the Cores window.
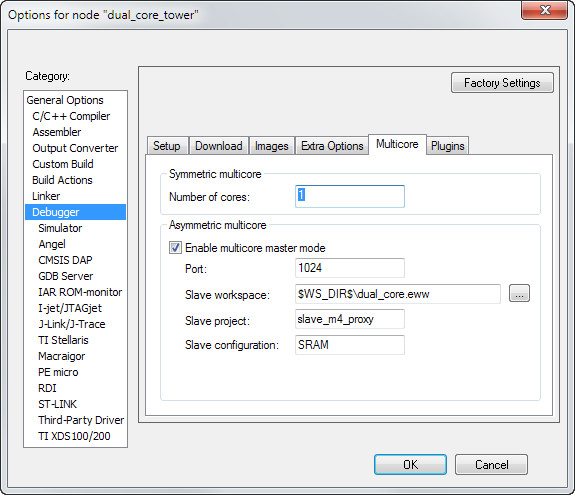
Doing the correct setup
There is some special setup to handle, but not much. For instance, in the asymmetric case, for the master session you must declare it as a multicore master, and also describe what project to use as a partner. For the partner, we have already mentioned that if the master programs the device, the partner debug session cannot do it. Also the selected reset strategy must not affect the master session, so usually partner sessions use some kind of software reset.
Summary
Once the setup is made, and honestly that’s where most problems might exist, multicore debugging has never been easier than it is with IAR Embedded Workbench for Arm. If you have used the tools for debugging monocores before, you will recognize everything included in this new feature and you will probably never understand other people talking about how difficult multicore debugging is for them.